A snapshot of the stats from the 2024 Renewable Report
Towards the end of last year, we conducted a survey among industry professionals to identify the topics most important to them in the world of clean energy. We then compile these findings in our Trends Report 2024. As part of this report, we also identified the key statistics around the use of the RatedPower platform.
In this blog, we’ll distill the key data points that we found and explore the stats driving the renewable energy industry in 2024.
- Published by


30 Apr, 24
About the survey
Our survey sourced insights from energy industry professionals spanning 30 countries. We covered a diverse range of renewable sectors to ensure comprehensive data collection. Almost 90% of respondents were from the solar industry, while there was also significant representation from the storage and wind sectors.
Download the full report to learn about some of the other innovations and delve deeper into these trends.


Key stats
RatedPower
The number of simulations on the RatedPower platform significantly increased in 2023. In fact, if you added together just the two busiest months of simulations from that year, the total volume would surpass the total volume recorded for all of 2022.
Within these simulations, we observed a subtle shift throughout 2023 in the average rated power, which experienced a marginal decrease from Q1 through Q4. This trend indicates that simulations of smaller installations became more prevalent as the year progressed.
Module preferences
From the perspective of module preferences, one significant trend observed in 2023 was a substantial shift towards bifacial modules. These modules have gained considerable traction in recent years due to their increased efficiency and are now preferred by many industry experts. Our survey data shows that over 90% of simulations conducted in Q4 2023 used bifacial modules, highlighting their growing prominence.
As well as module types, we also saw clear trends around module manufacturers. Trina Solar, Jinkosolar, and JA Solar were the top module manufacturers used in our simulations. Each manufacturer has demonstrated consistent performance and reliability over long periods, contributing to their popularity among users.
That said, another factor when it comes to module manufacturers is average rated power. Our data shows that in 2023, Mingyang Solar outperformed its counterparts with the highest average rated power per simulation.
Inverter preferences
Turning our attention to inverters, the 2023 data revealed a noticeable trend towards string inverters. This shift can indicate a rising interest in smaller photovoltaic (PV) plant designs where these types of inverters are most commonly used or the increased capabilities of modern string inverters. Among manufacturers, Sungrow and Huawei stand out as the favorites for designers in their simulations.
String inverters offer several benefits that make them attractive options for small-scale projects. They’re typically easier to install and maintain than their larger counterparts, making them ideal for installations with space limitations or budget constraints. In addition, they provide greater design flexibility, which allows you to customize your energy production according to more specific needs.
However, this is not to say that central inverters are losing ground entirely. Central inverters continue to play a significant role in large-scale solar installations due primarily to their higher-rated power capabilities. To put it into perspective, projects utilizing central inverters typically possess 2.5 times higher rated power than those using string inverters. This substantial difference underscores why they remain popular in countries with large expanses of land for development.
Structure preferences
Data from our platform revealed that both fixed and tracker structures share a similar amount of popularity, with tracker structures only slightly ahead. This slight preference for tracker structures implies a preference for efficiency and adaptability in plant design.


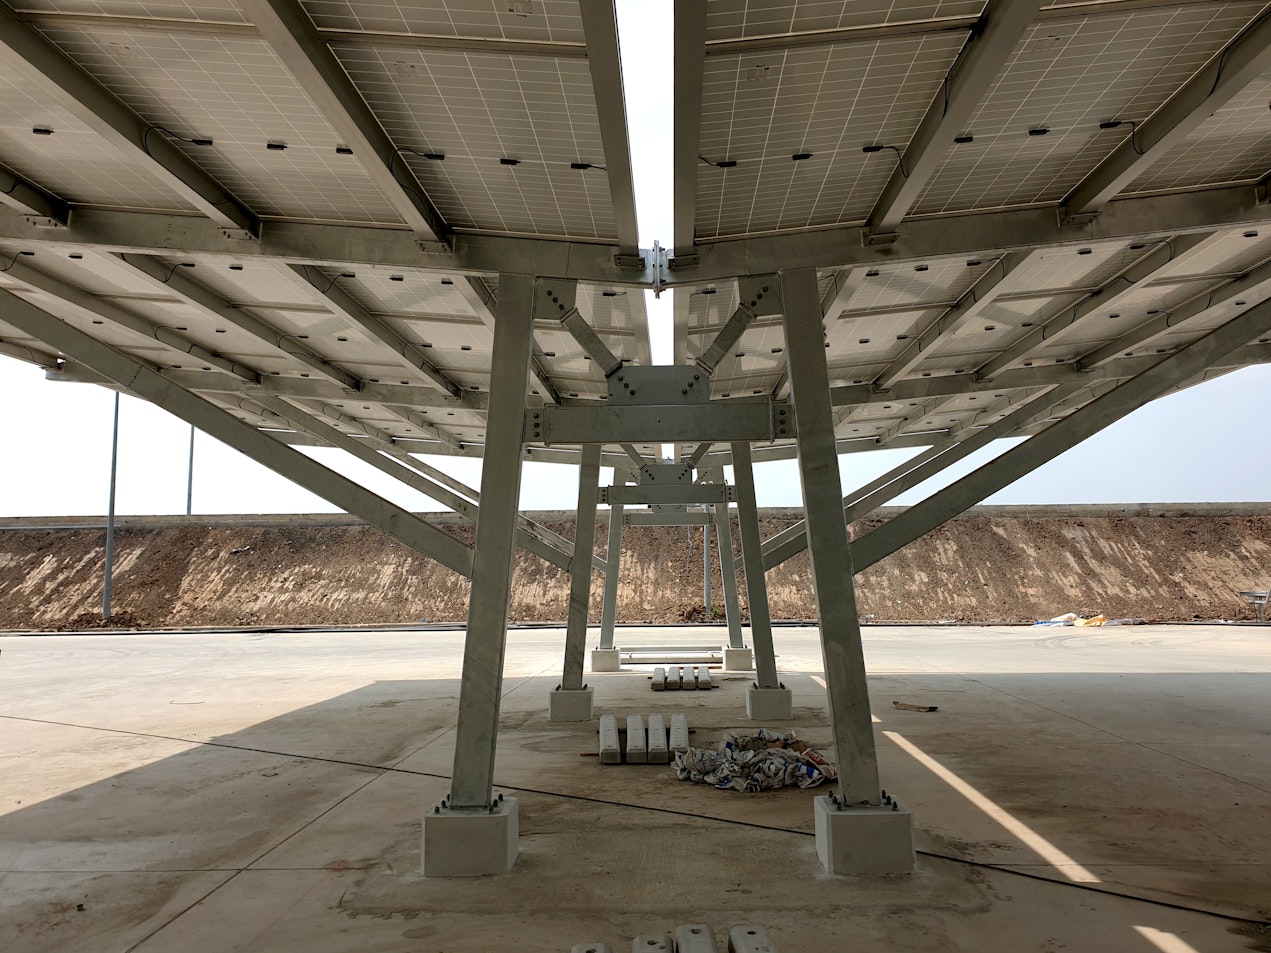
Nextracker, a leading name in the solar industry, emerged as the most utilized manufacturer of these tracking systems on the RatedPower platform.
One area where we saw structure preferences change dramatically was geography. Platform data shows that large countries like Australia, Brazil, and the US all have a distinct preference for tracker structures over fixed.
BESS
The final area that showed some interesting statistics was battery energy storage systems (BESS). This technology is becoming increasingly important in the integration of renewable systems, as evidenced by our survey data showing that hybrid plants with BESS accounted for 10-13% of simulations. In particular, AC BESS was the preferred choice in most hybrid scenarios.
Do you wonder wether alternating current (AC) or direct current (DC) batteries are the best option? In this eBook, we’ll look at these two options in-depth and explore which type is best for which situation when it comes to designing a solar installation.
The growing importance and adoption of BESS aren’t just confined to our findings alone. The United States Energy Information Administration (EIA) projects a significant surge in battery storage capacity within the next few years. It predicts that this capacity will almost double by 2024, underlining how critical these systems are becoming.
On the other side of the Atlantic, Europe also foresees an impressive future for grid-scale battery energy storage uptake. According to Aurora Energy Research’s latest report, projections indicate a sevenfold increase in capacity to reach 51 gigawatts (GW) by 2030. This is a growth trajectory representing a whopping €78bn (£66.3bn) investment opportunity by the middle of the century.
Drilling down further into Europe’s national trends, Britain, Italy, and Ireland are the countries leading the charge in battery storage investments. Of particular note is Italy, which has set lofty goals, aiming for at least 9 GW of battery capacity by the end of this decade.
Download the full report to examine the RatedPower platform's stats in more detail and learn more about user preferences.
What you should do now
Whenever you’re ready, here are 4 ways we can help you grow your solar business and reduce LCOE of your PV plants.
- Get hands-on with a free RatedPower self-service guided tour. If you’d like to learn the ins and outs of how top photovoltaic software can help your engineering team, go ahead and request your free demo. One of our solar experts will understand your current design and engineering workflows, and then suggest practical tips on how to speed up them though the right tool.
- Let's get physical, physical! Learn the latest on renewable energy and PV in the second edition of Pulse, our annual get-together full of technical workshops, inspiring talks from energy leaders and tons of networking. Learn more.
- If you’d like to learn insights, ideas and inspiration for the low-carbon energy transition for free, go to our blog or visit our resources section, where you can download guides, templates and checklists solar successful pros use.
- If you’d like to work with other passionate experts on our team, or learn more about our purpose and corporate values, then see our Careers page.
- If you know another solar designer, developer or engineer who’d enjoy reading this page, share it with them via email, LinkedIn or Twitter.
Related posts
Searching results